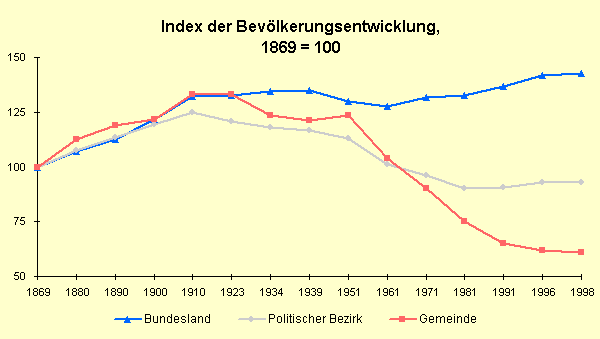
| 1. Bevölkerungsentwicklung 1869 - 1998 | ||||||
| (Quelle: Statistik Österreich; Volkszählungsergebnisse; Gebietsstand 15. 5. 1991; 1996, 1998 (31.12.): Hauptwohnsitz-Einwohnerzahlen) | ||||||
| Jahr | Gemeinde | Politischer Bezirk | Bundesland | |||
| absolut | 1869=100 | absolut | 1869=100 | absolut | 1869=100 | |
| 1869 | 2.847 | 100 | 78.397 | 100 | 1.077.226 | 100 |
| 1880 | 3.204 | 113 | 84.228 | 107 | 1.152.381 | 107 |
| 1890 | 3.390 | 119 | 89.020 | 114 | 1.213.463 | 113 |
| 1900 | 3.462 | 122 | 93.549 | 119 | 1.310.499 | 122 |
| 1910 | 3.785 | 133 | 97.946 | 125 | 1.425.238 | 132 |
| 1923 | 3.794 | 133 | 94.694 | 121 | 1.426.885 | 132 |
| 1934 | 3.511 | 123 | 92.436 | 118 | 1.446.678 | 134 |
| 1939 | 3.457 | 121 | 91.527 | 117 | 1.455.319 | 135 |
| 1951 | 3.516 | 123 | 88.680 | 113 | 1.400.471 | 130 |
| 1961 | 2.955 | 104 | 79.405 | 101 | 1.374.012 | 128 |
| 1971 | 2.570 | 90 | 75.246 | 96 | 1.420.816 | 132 |
| 1981 | 2.139 | 75 | 70.744 | 90 | 1.427.849 | 133 |
| 1991 | 1.852 | 65 | 70.922 | 90 | 1.473.813 | 137 |
| 1996 | 1.760 | 62 | 72.996 | 93 | 1.529.685 | 142 |
| 1998 | 1.729 | 61 | 72.769 | 93 | 1.538.342 | 143 |

| 2. Bevölkerungsentwicklung durch Geburten- und errechnete Wanderungsbilanz | |||||||
| (Quelle: Statistik Österreich; Volkszählungsergebnisse; Gebietsstand 15. 5. 1991) | |||||||
| Wohnbevölkerung | Gemeinde | Politischer Bezirk | Bundesland | ||||
| absolut | in % | absolut | in % | absolut | in % | ||
| Veränderung 1961-1971 | |||||||
| insgesamt | -385 | -13,0 | -4.159 | -5,2 | 46.804 | 3,4 | |
| durch Geburtenbilanz | -46 | -1,6 | 929 | 1,2 | 48.208 | 3,5 | |
| durch Wanderungsbilanz | -339 | -11,5 | -5.088 | -6,4 | -1.404 | -0,1 | |
| Veränderung 1971-1981 | |||||||
| insgesamt | -431 | -16,8 | -4.502 | -6,0 | 7.033 | 0,5 | |
| durch Geburtenbilanz | -262 | -10,2 | -3.737 | -5,0 | -27.030 | -1,9 | |
| durch Wanderungsbilanz | -169 | -6,6 | -765 | -1,0 | 34.063 | 2,4 | |
| Veränderung 1981-1991 | |||||||
| insgesamt | -287 | -13,4 | 178 | 0,3 | 45.964 | 3,2 | |
| durch Geburtenbilanz | -155 | -7,2 | -2.945 | -4,2 | -19.117 | -1,3 | |
| durch Wanderungsbilanz | -132 | -6,2 | 3.123 | 4,4 | 65.081 | 4,6 | |
| 3. Wohnbevölkerung nach Alter und Geschlecht | |||||||||
| (Quelle: Statistik Österreich; VZ91, VZ81; Gebietsstand 15. 5. 1991) | |||||||||
| Wohnbevölkerung | Gemeinde | Politischer Bezirk | Bundesland | ||||||
| 1991 | 1981 | Änd. % | 1991 | 1981 | Änd. % | 1991 | 1981 | Änd. % | |
| Insgesamt | 1.852 | 2.139 | -13,4 | 70.922 | 70.744 | 0,3 | 1.473.813 | 1.427.849 | 3,2 |
| 0 - 14 Jahre | 237 | 320 | -25,9 | 12.319 | 13.471 | -8,6 | 255.633 | 284.003 | -10,0 |
| 15 - 59 Jahre | 1.036 | 1.220 | -15,1 | 42.351 | 41.337 | 2,5 | 905.759 | 857.498 | 5,6 |
| 60 u. m. Jahre | 579 | 599 | -3,3 | 16.252 | 15.936 | 2,0 | 312.421 | 286.348 | 9,1 |
| Männlich | 847 | 959 | -11,7 | 34.523 | 33.410 | 3,3 | 715.709 | 681.831 | 5,0 |
| 0 - 14 Jahre | 111 | 141 | -21,3 | 6.406 | 6.840 | -6,3 | 131.132 | 145.290 | -9,7 |
| 15 - 59 Jahre | 534 | 625 | -14,6 | 22.046 | 21.006 | 5,0 | 465.495 | 431.813 | 7,8 |
| 60 u. m. Jahre | 202 | 193 | 4,7 | 6.071 | 5.564 | 9,1 | 119.082 | 104.728 | 13,7 |
| Weiblich | 1.005 | 1.180 | -14,8 | 36.399 | 37.334 | -2,5 | 758.104 | 746.018 | 1,6 |
| 0 - 14 Jahre | 126 | 179 | -29,6 | 5.913 | 6.631 | -10,8 | 124.501 | 138.713 | -10,2 |
| 15 - 59 Jahre | 502 | 595 | -15,6 | 20.305 | 20.331 | -0,1 | 440.264 | 425.685 | 3,4 |
| 60 u. m. Jahre | 377 | 406 | -7,1 | 10.181 | 10.372 | -1,8 | 193.339 | 181.620 | 6,5 |

| 4. Altersgruppen in Prozent der Wohnbevölkerung | ||||||
| (Quelle: Statistik Österreich; VZ91, VZ81; Gebietsstand 15. 5. 1991) | ||||||
| Wohnbevölkerung nach Altersgruppen | Gemeinde | Politischer Bezirk | Bundesland | |||
| 1991 | 1981 | 1991 | 1981 | 1991 | 1981 | |
| 0 - 14 Jahre | 12,8 | 15,0 | 17,4 | 19,0 | 17,3 | 19,9 |
| 15 - 59 Jahre | 55,9 | 57,0 | 59,7 | 58,4 | 61,5 | 60,1 |
| 60 u. m. Jahre | 31,3 | 28,0 | 22,9 | 22,5 | 21,2 | 20,1 |
| Männer auf 1.000 Frauen | 843 | 813 | 948 | 895 | 944 | 914 |

Letzte Aktualisierung 16.3.2000